
Mta Turnstile Data
MTA has publicly available datasets on turnstile activity. The data is recorded weekly. Here I analyze the collected data in a certain time interval (end of April through beginning of June). I identify the most frequent subway stations and the busiest times on a given day of an average week (Monday, Tuesday, .. Sunday). As expected, the commuter hub stations such as 34St - Penn Station, 42St - Grand Central, 34St - Herald Square or 42St - Times Square show most turnstile activity. The goal of this brief investigation is to find other frequent commuter stations that might not be easily identified based on transit patterns.
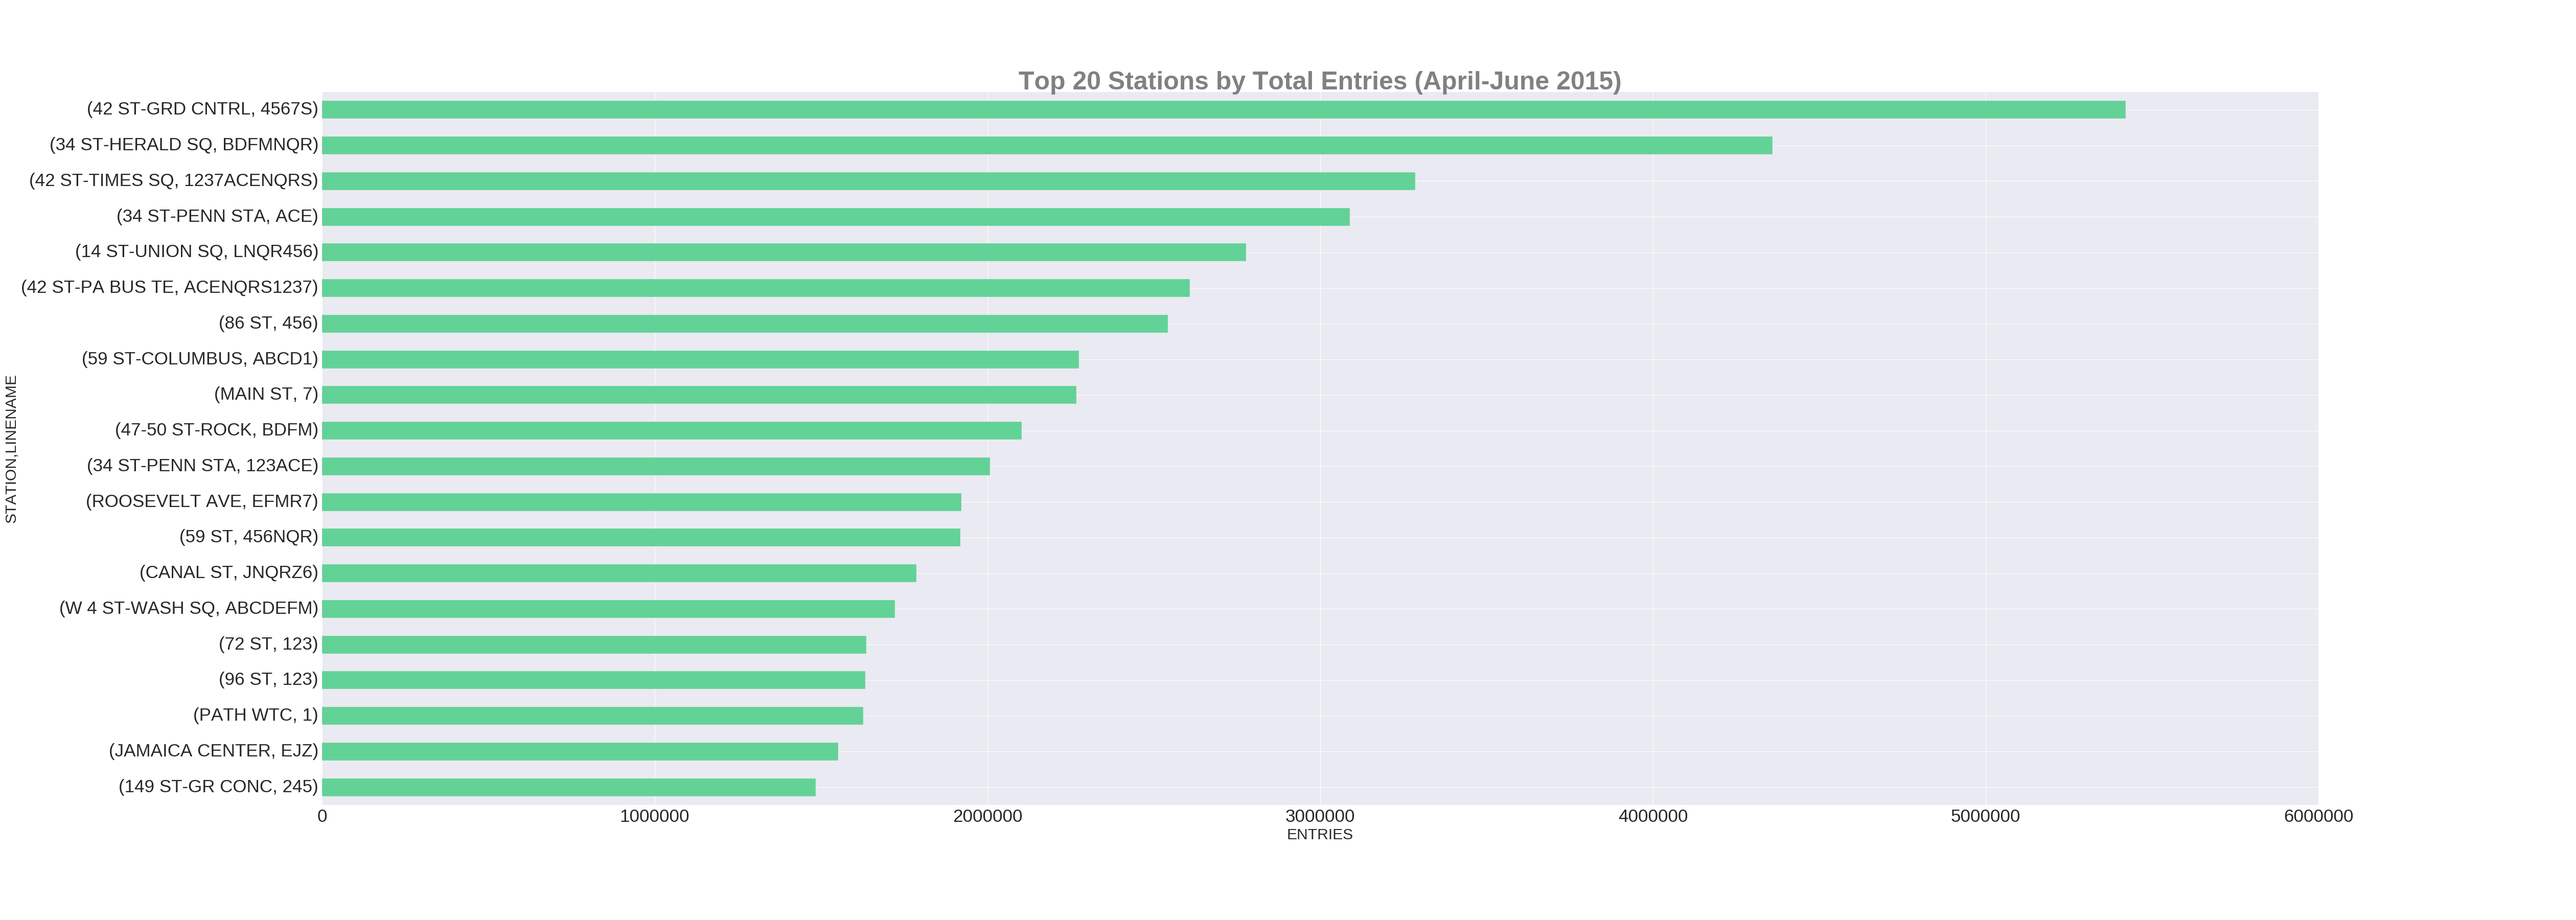
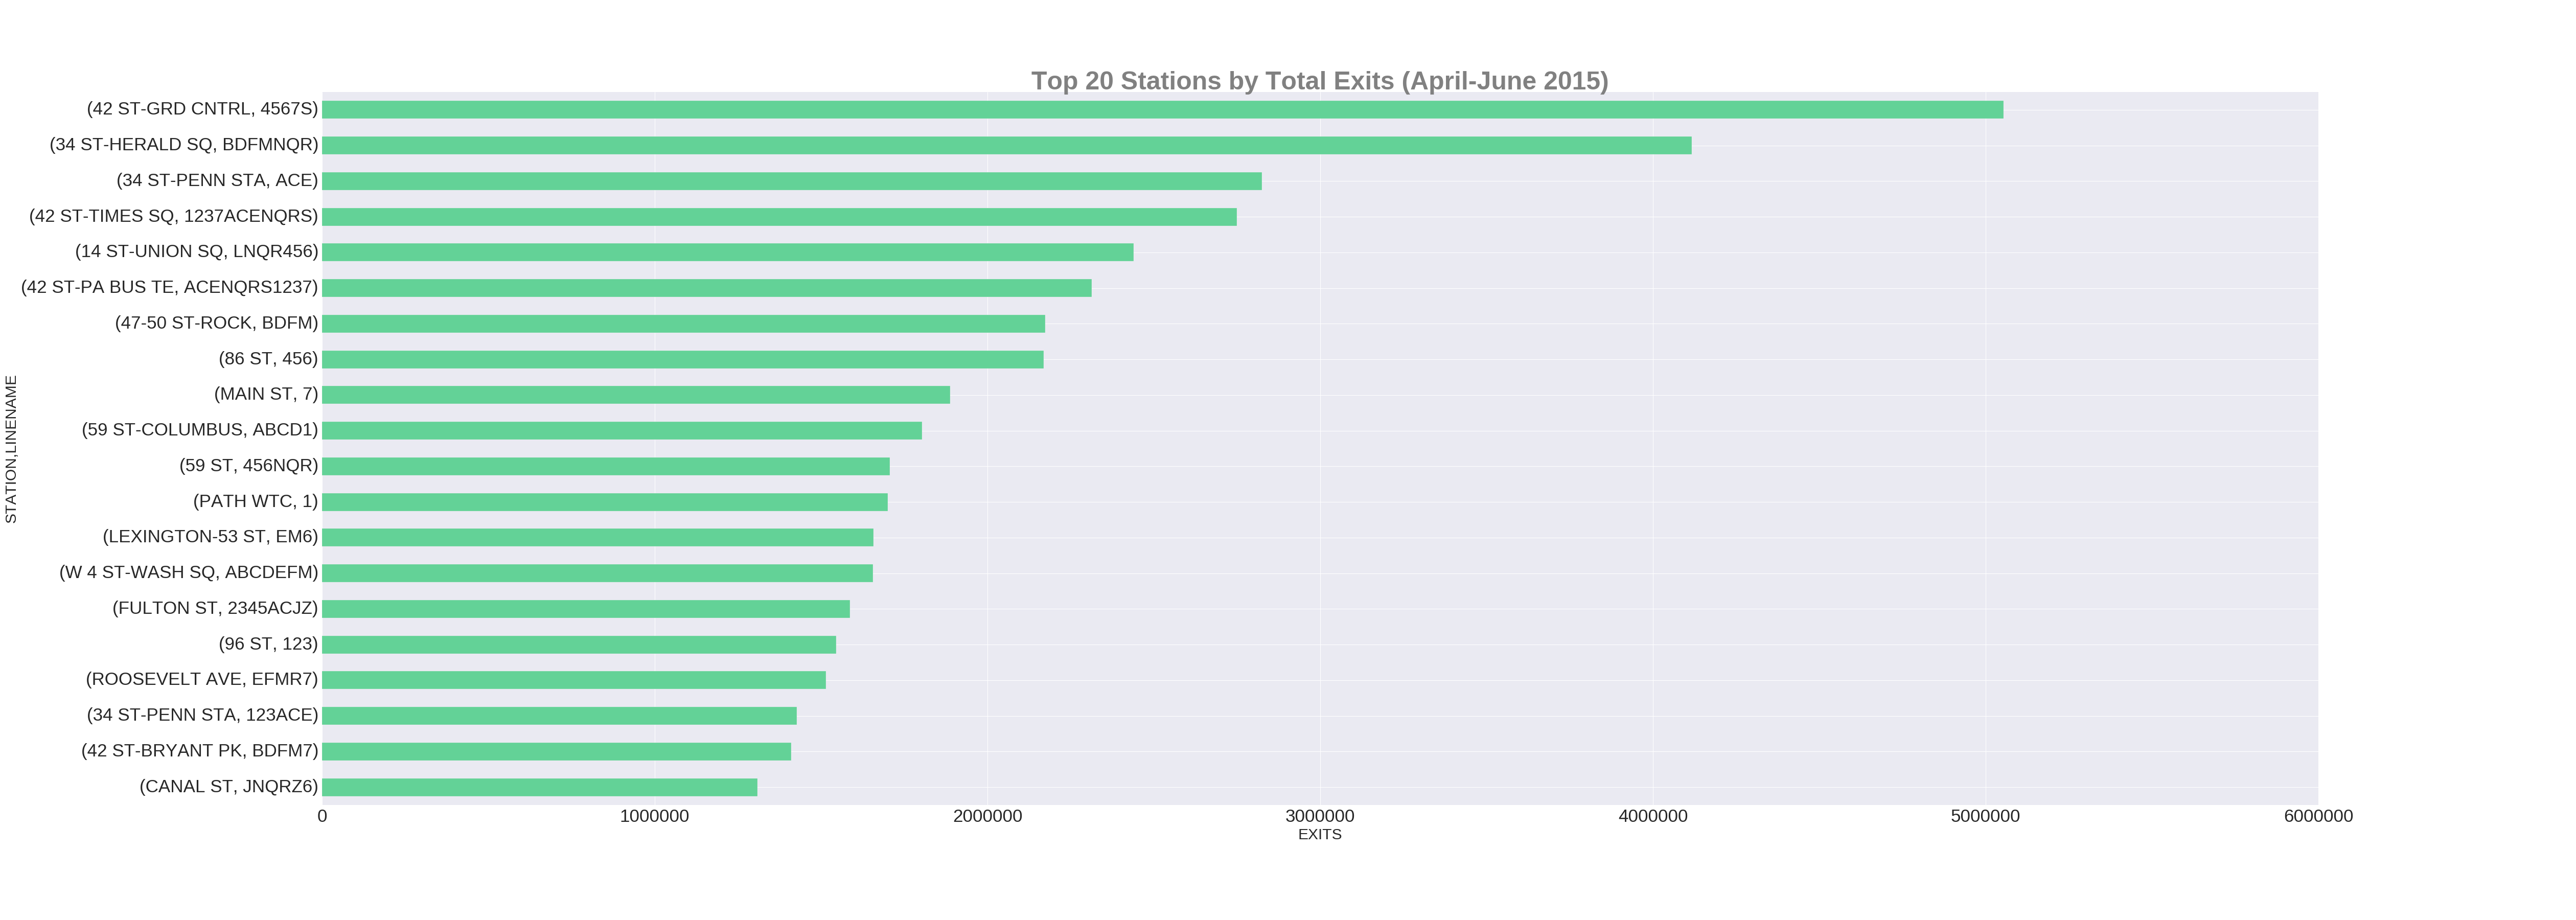
The two figures below show the top 20 stations in terms of most entries and exits. Notice that a station in the dataset is uniquely identified by a station name and line name. For example, 86th street on Upper East Side is ‘‘86 ST, 456’’. Similarly, Penn Station, New York is characterized by three turnstile groups: ‘‘34ST-PENN STA, ACE’’, ‘‘34ST-PENN STA, 123ACE’’, and ‘‘34ST-PENN STA, 123’’. The ambiguity in the 34ST-Penn Station notation is unfortunate. However, most stations identifiers are unique and I deal with the few that are not case by case. A closer analysis, where I count all subway lines per station, shows ‘‘34ST-PENN STA’’ as the number one hub for commuters, followed by ‘‘42ST-GRD CNTRL’’ (Grand Central Station) and ‘‘34ST-HERALD SQ’’. Similarly as ‘‘34ST-HERALD SQ’’, ‘‘14ST-UNION SQ’’, ‘‘47-50 ST-ROCK’’ (Rockefeller Center), ‘‘59ST-COLUMBUS’’ (Columbus Circle), ‘‘CANAL ST’’, ‘‘W 4 ST-WASH SQ’‘(Washington Square), ‘‘PATH WTC 1’’ (World Trade Center) and ‘‘JAMAICA CENTER’’ show a lot of turnstile traffic; this traffic can be explained by multiple subway lines (or subway, PATH or other train lines) intersecting at these stations (so called ‘‘commuters junctions’’). Interestingly, ‘‘86 ST, 456’’ (Upper East Side) and ‘‘72 ST, 123’’ (Upper West Side) show comparable amount of turnstile traffic to the commuter junctions and hubs, and I will analyze these stations along with a typical commuter’s hub station next.
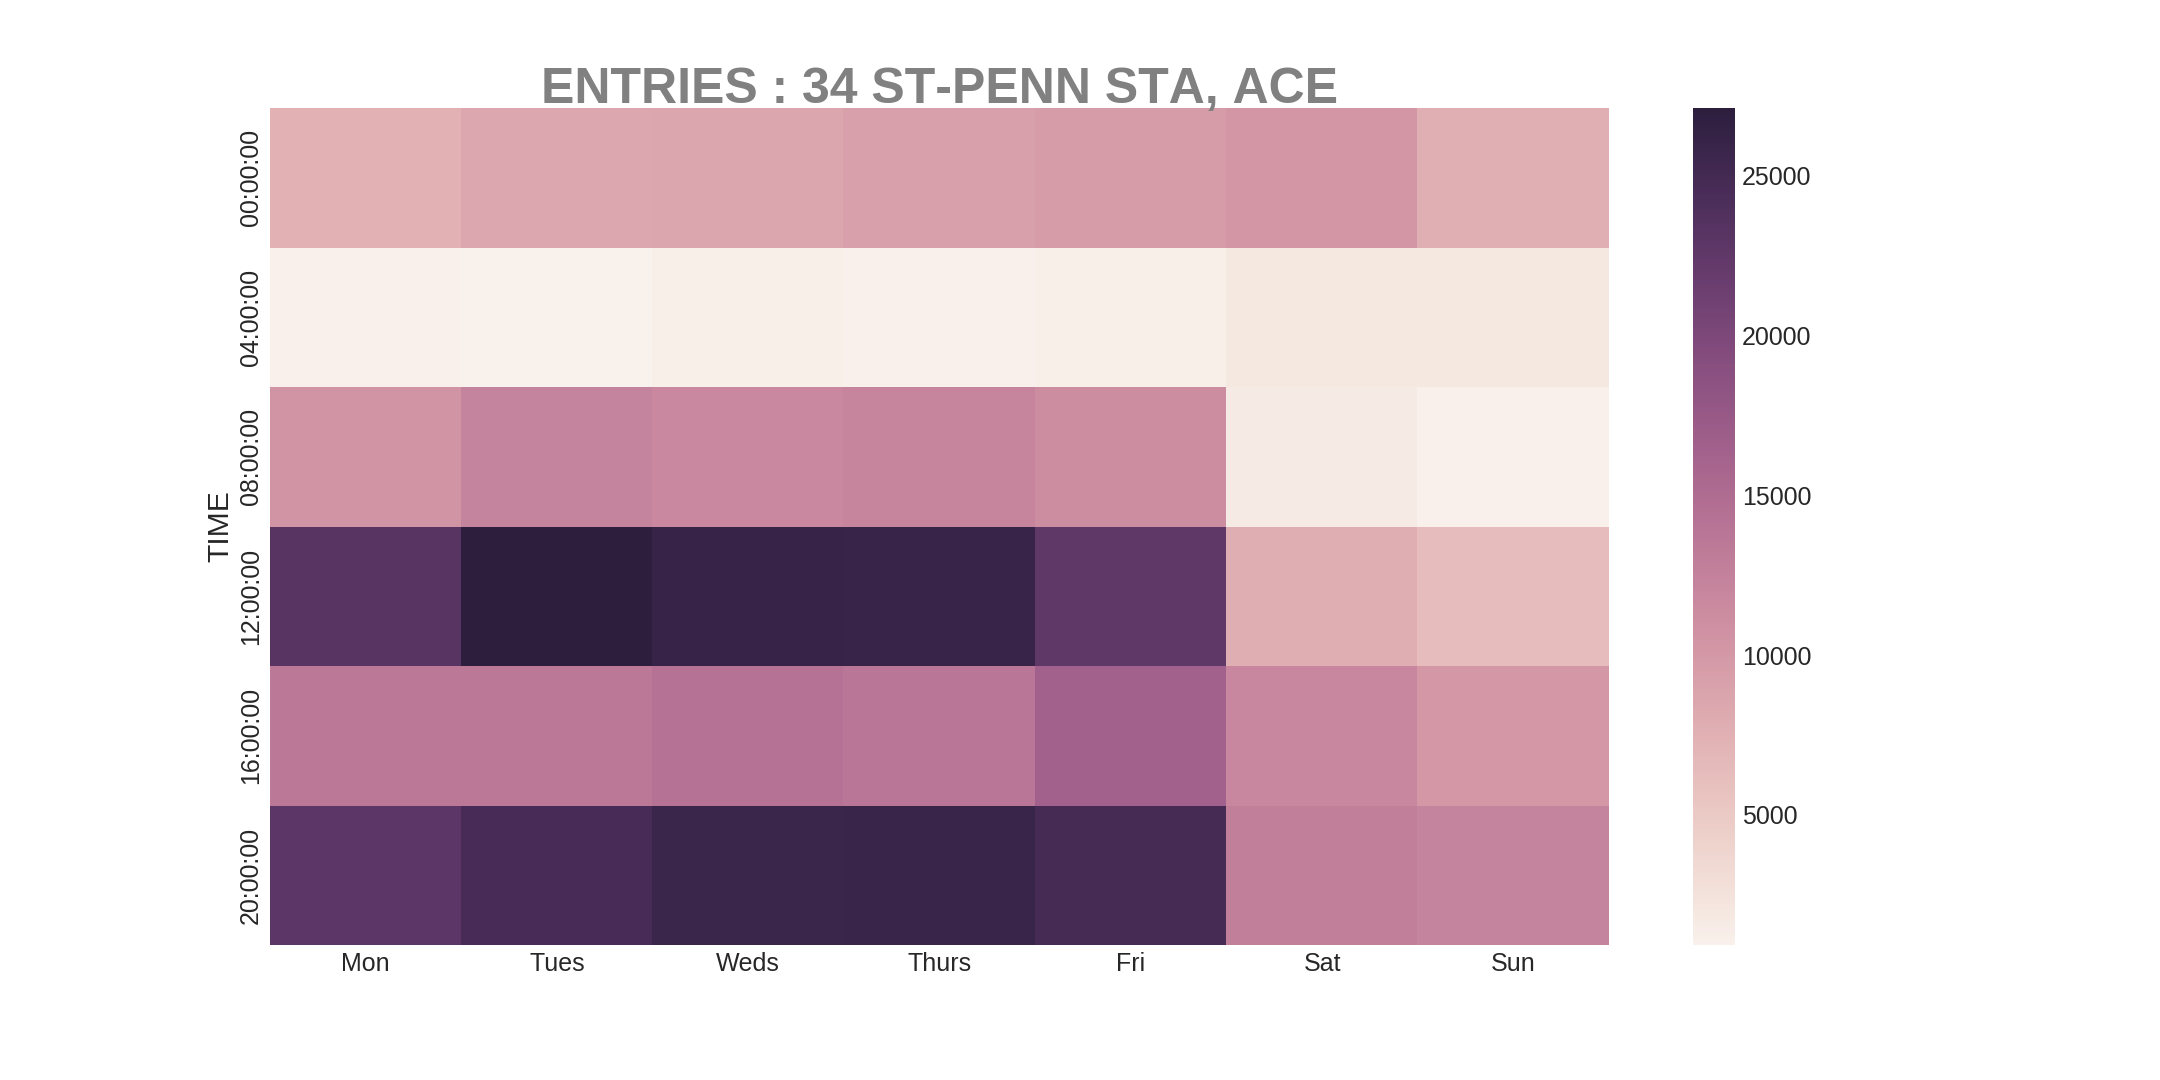
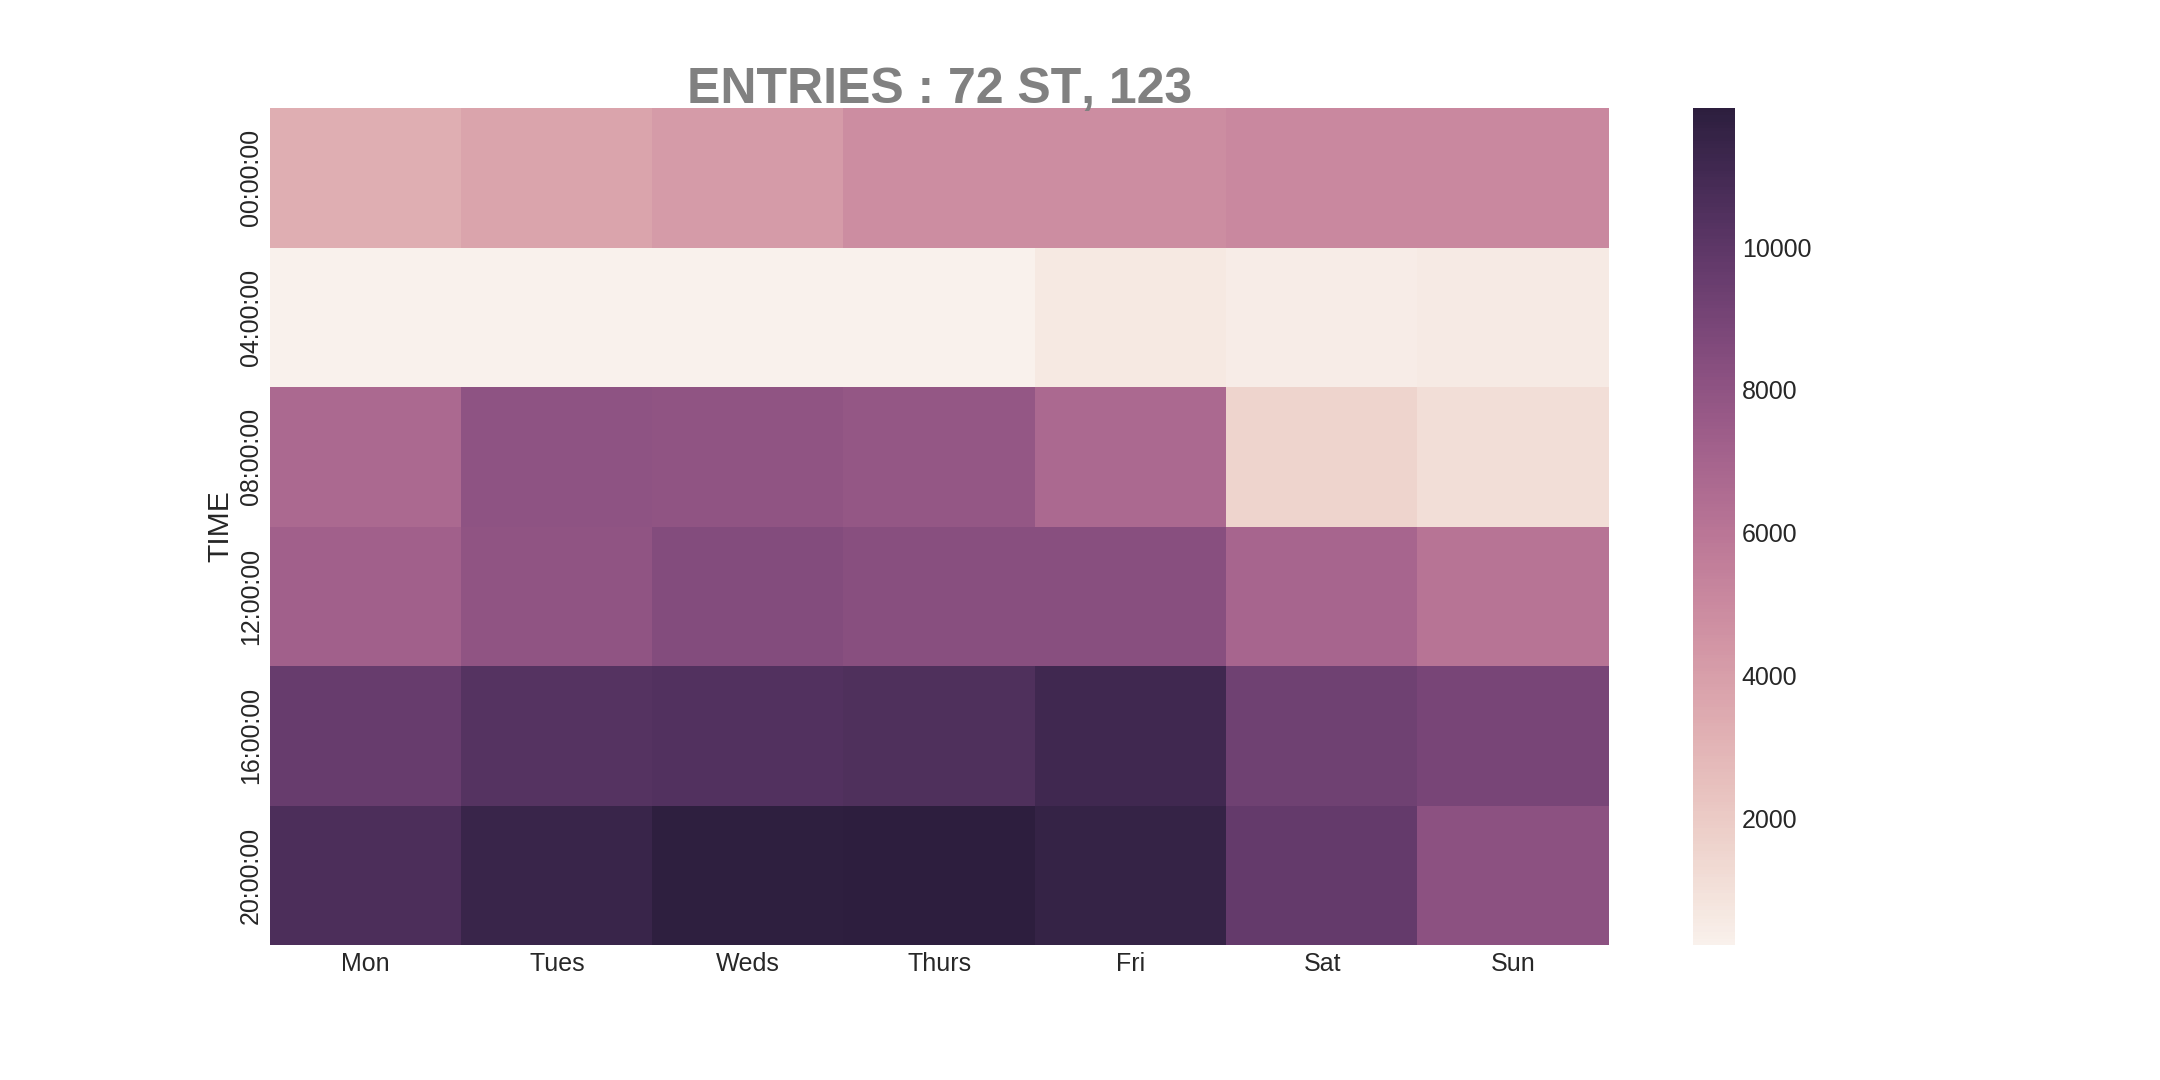
In order to get a feeling for how the turnstile traffic looks for an average week, I create heatmaps that show the number of entries/exits as a function of day and a 4-hour time block. For example, 04:00:00 block shows the number of entries/exits in the midnight (00:00:00) to 4am time window. Similarly, 20:00:00 block shows the number of entries/exits in the 4pm (16:00:00) to 8pm (20:00:00) time window, that is, generally during the afternoon peak traffic hours.
I compare turnstile entries for three stations: ‘‘34 ST-PENN STA, ACE’’, ‘‘86 ST, 456’’ and ‘‘72 ST, 123’’ in the figures below. Notice that Penn Station has two very characteristic commuter peaks during the morning and afternoon rush hours: 8am-noon and 4-8pm, Monday-Friday. I also see that Friday traffic is less pronounced than traffic during the other weekdays. I need to mention that my analysis includes the Memorial Day weekend which in turn contributes to less traffic on Mondays and Fridays, on average. Nevertheless, the morning and afternoon time window strips are clearly distinguished patterns in the (ACE) 34-ST PENN traffic (123-line turnstiles show comparable traffic pattern) and vanish during a weekend, as expected, because of less commute to/from the city. There are also no trains from/to Penn in the early mornings, and therefore there is almost no activity at the turnstiles during the midnight to 4am time window.
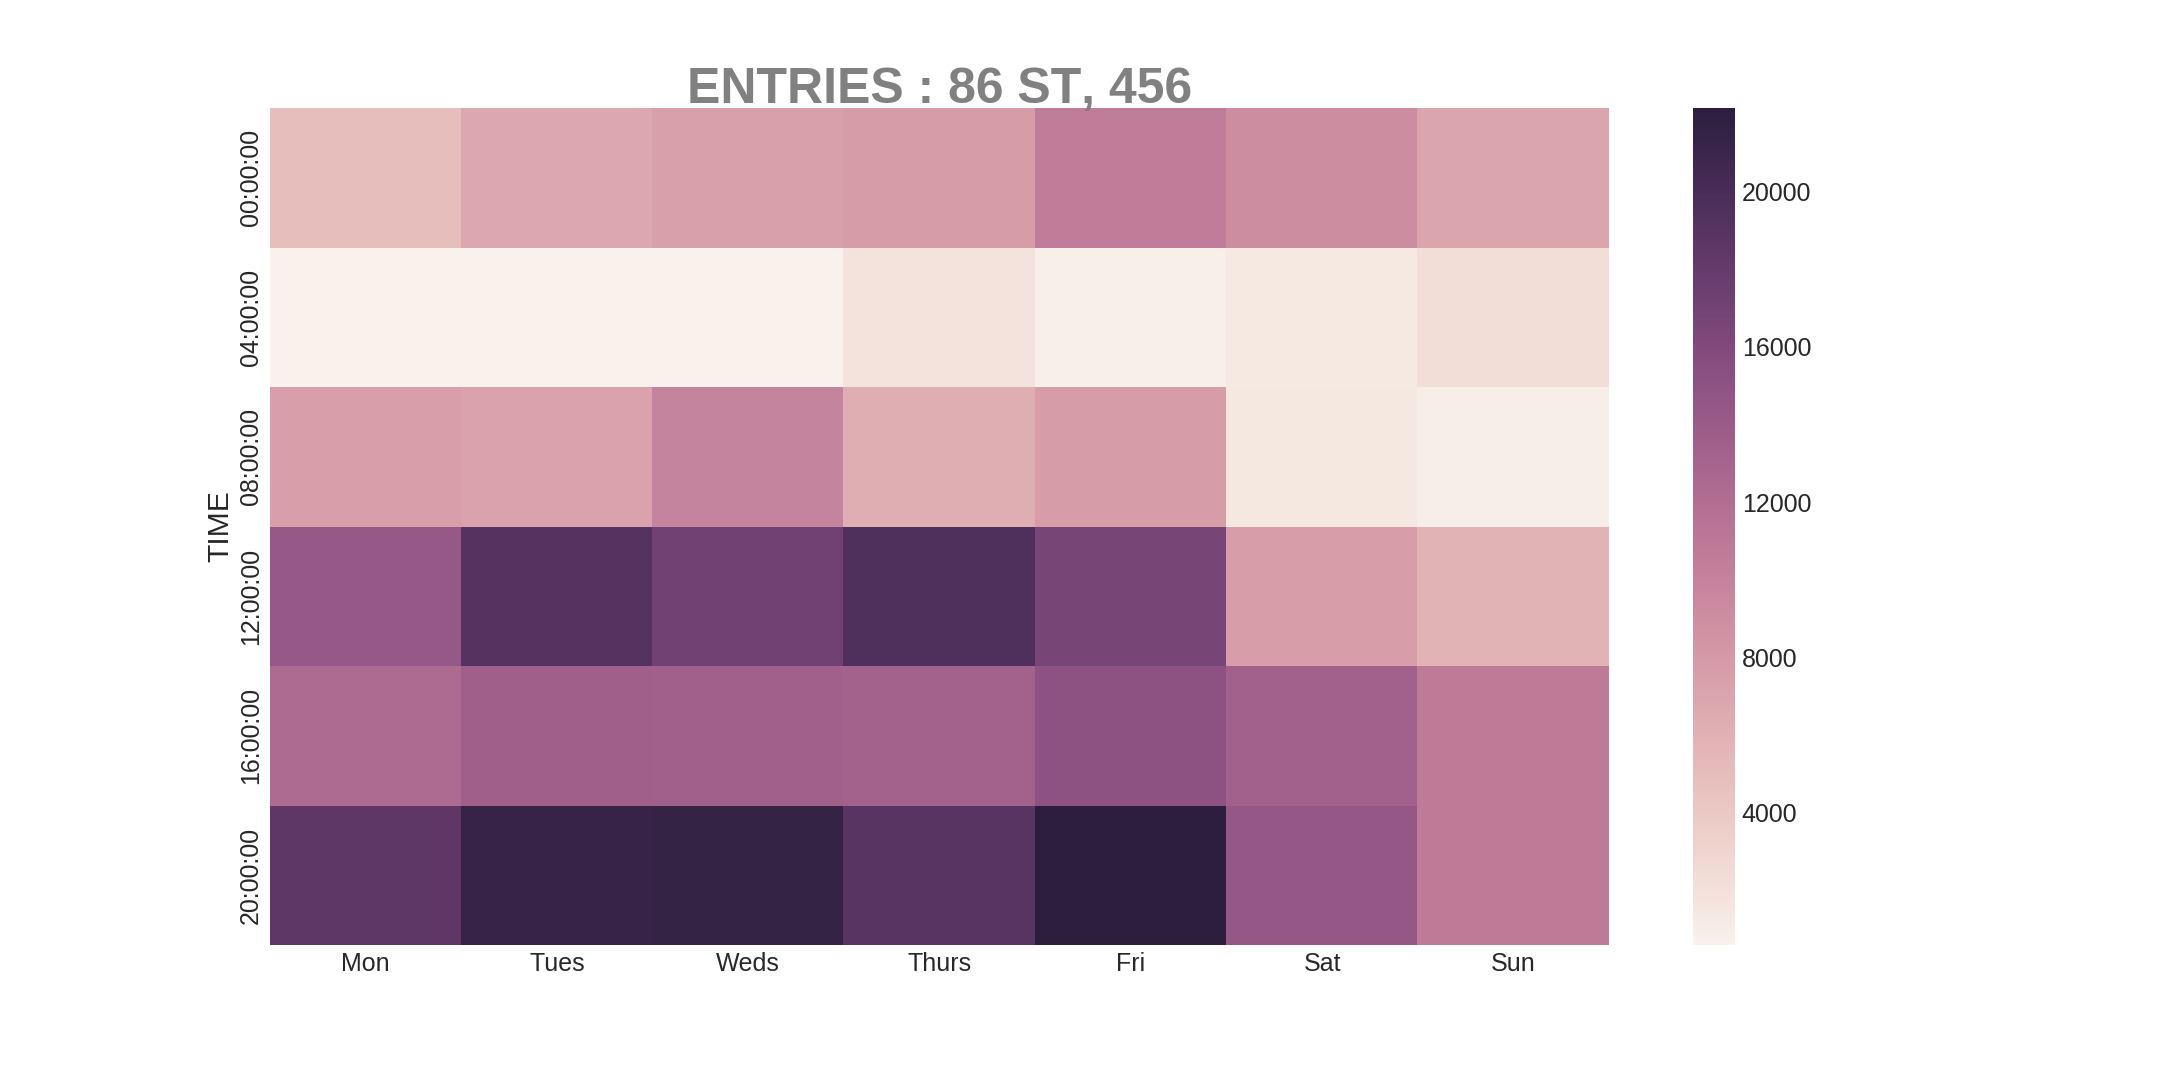
The ‘86 ST,456’ on the Upper East Side and ‘72 ST, 123’ on the Upper West Side show quite different patterns. In general, there is more activity during the day, especially in the early afternoon hours and on the weekends. There is also some activity entering or exiting the turnstiles late at night that is in volume comparable to Penn Station traffic.
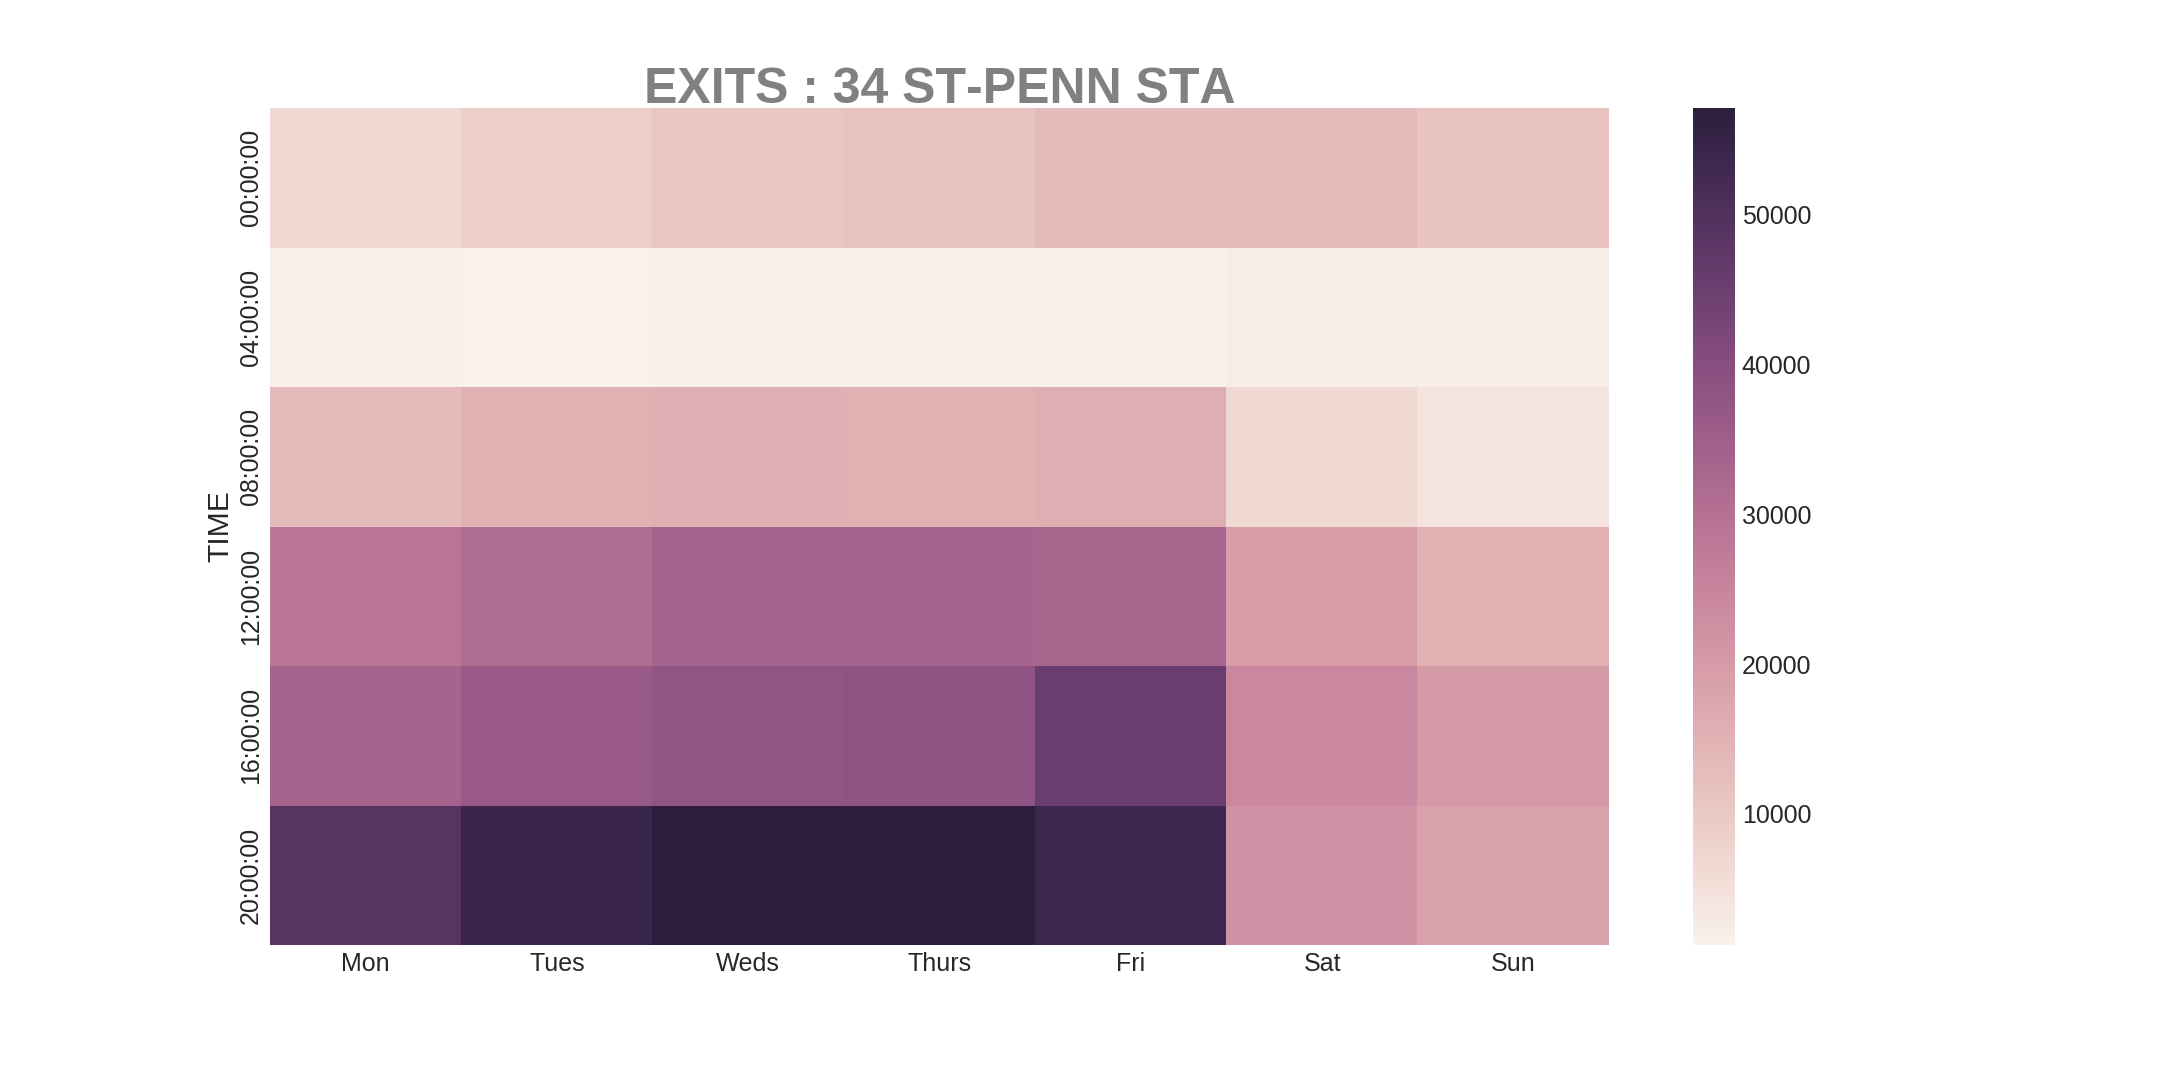
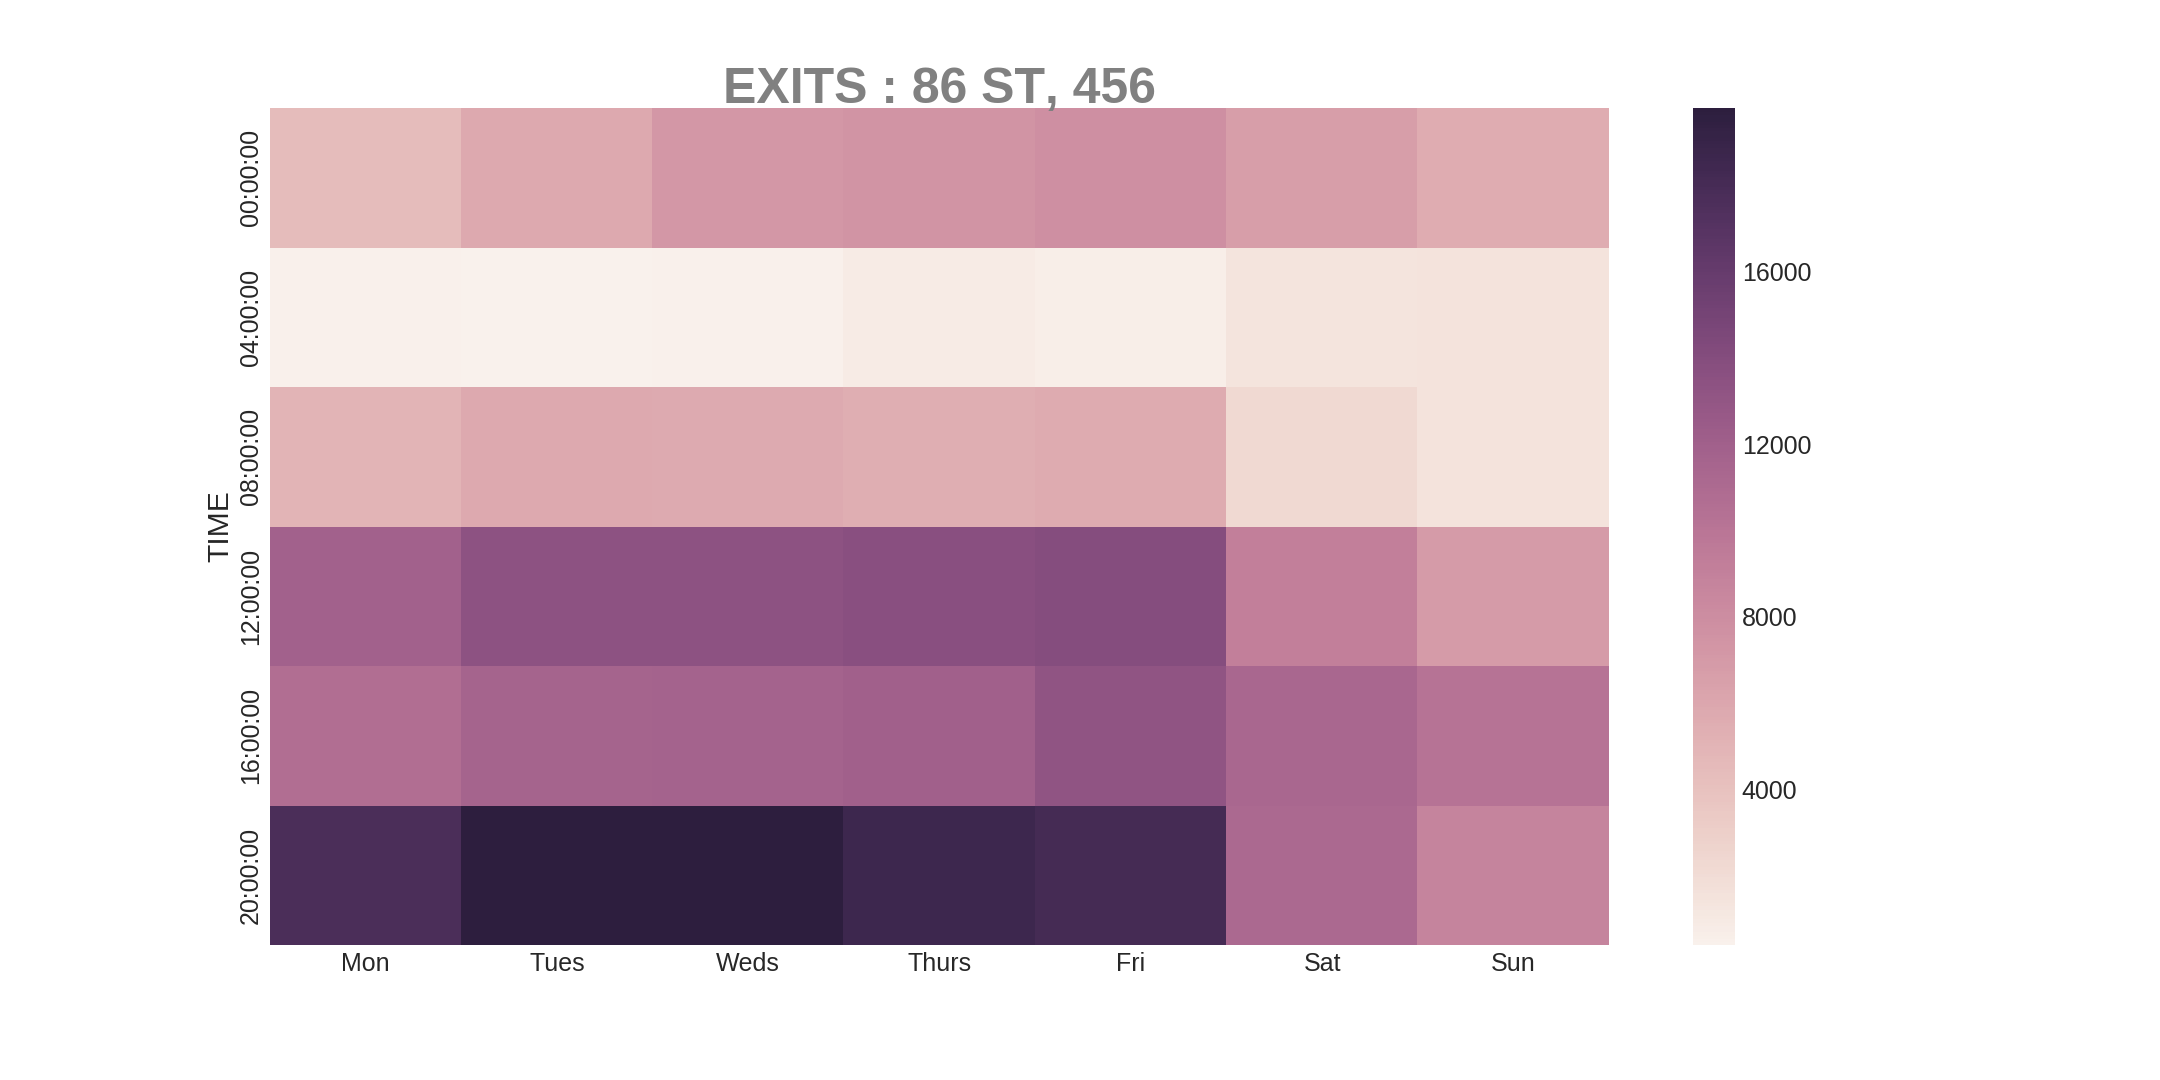
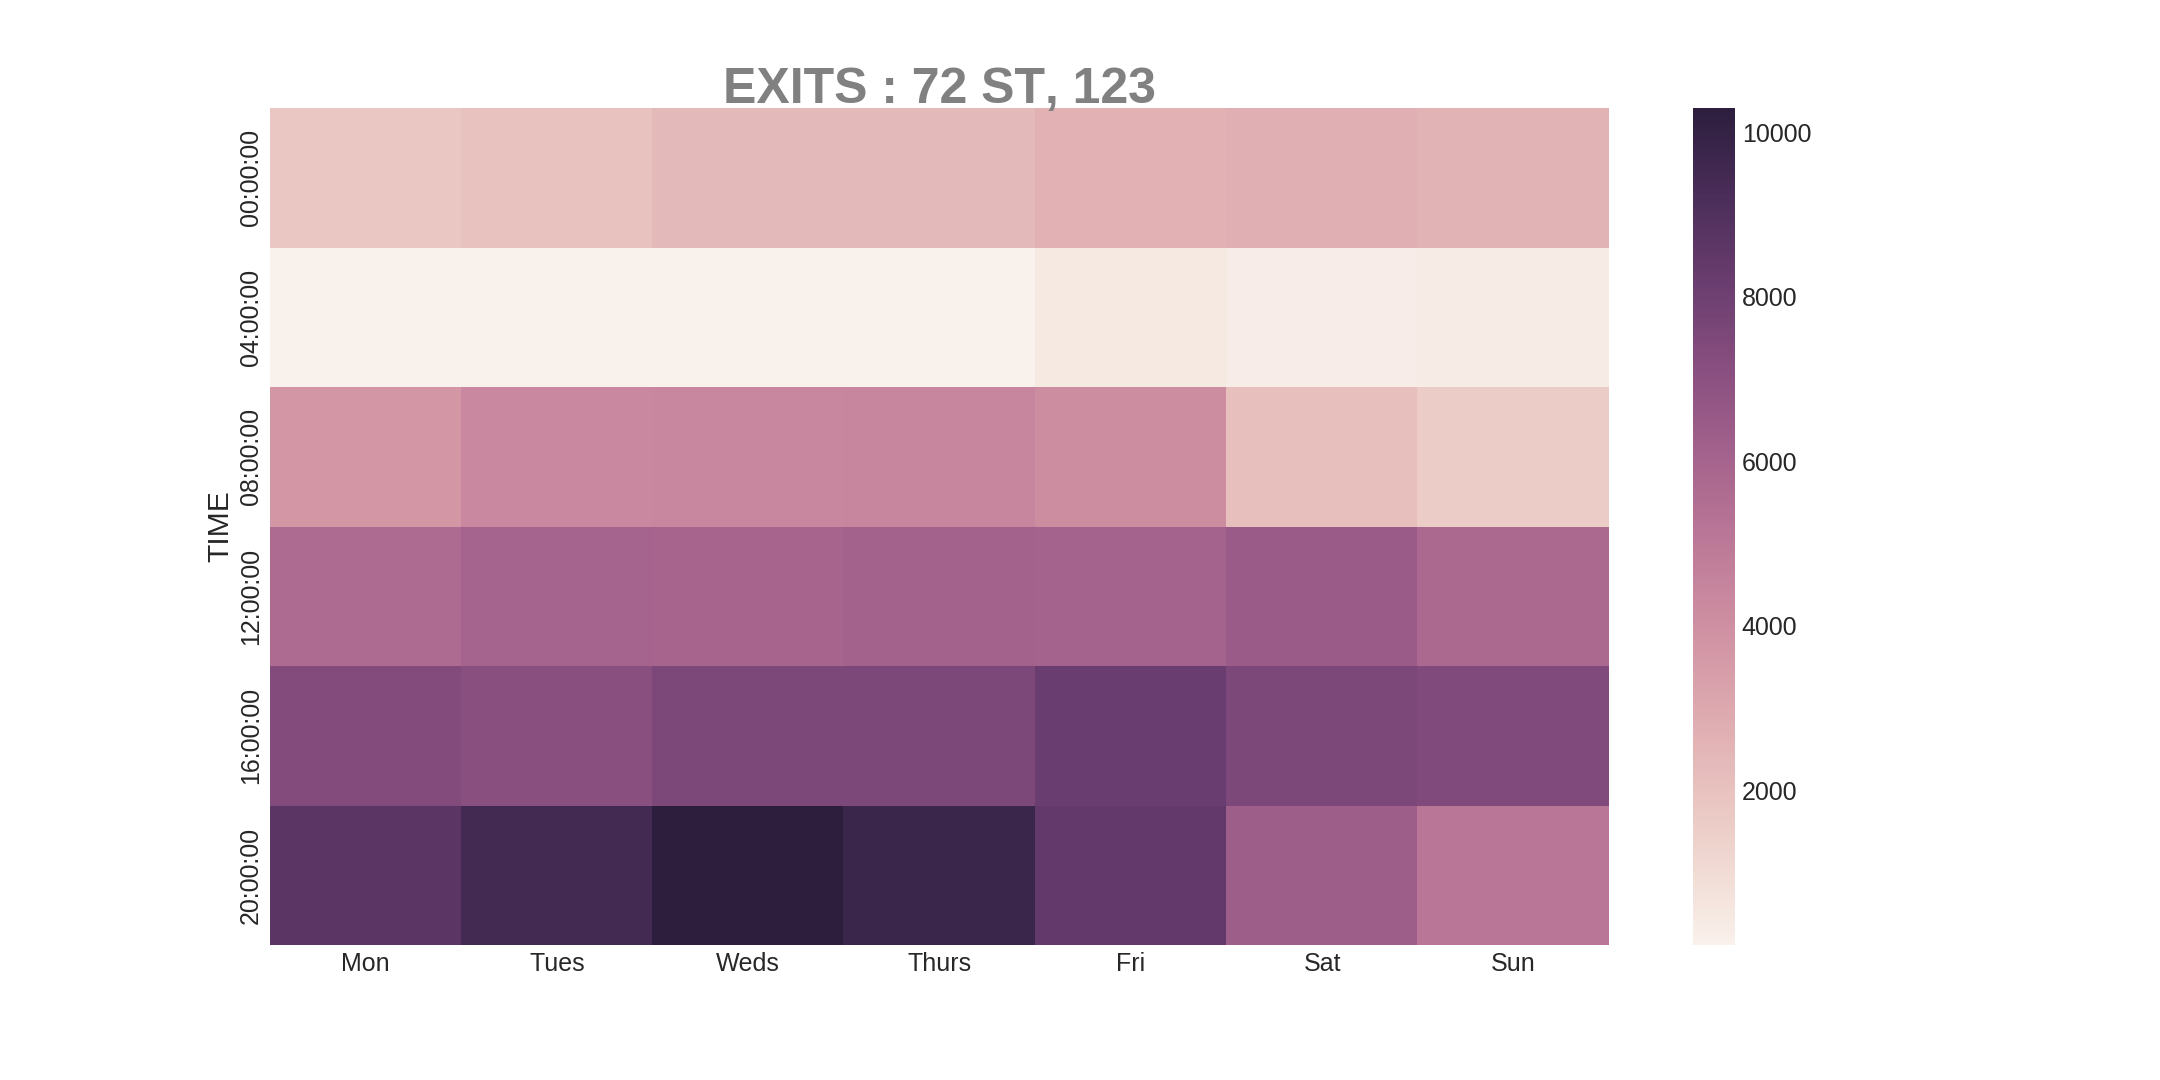
I also look at the traffic exiting the turnstiles for the same three stations: ‘‘34 ST-PENN STA’’ (traffic through all the turnstiles at Penn), ‘‘86 ST, 456’’ and ‘‘72 ST, 123’’. My results are plotted below. Penn Station exit turnstiles show less traffic during morning peak hours. That is, less people are leaving Penn Station subway turnstiles (e.g. to take trains) in the morning. The afternoon rush hour is clearly seen during the 4-8pm time strip Mondays-Thursdays and noon-8pm time window on Fridays. Similar patterns are seen for the ‘‘86 ST, 456” and ‘‘72 ST, 123”, with relatively more traffic during the weekends.
My analysis allows to compare subway traffic at different times for a given day, look at weekday vs. weekend traffic and compare traffic at ‘‘regular’’ vs. ‘‘commuter hub’’ stations. One of my future goals is to create a clickable app that would allow people to choose a subway station and see its average traffic patterns based on the entries/exits turnstile history, as well as try to predict future station traffic for a given time frame.
Acknowledments to: Ian London, Rachel Rho and Patrick Nieto. Source code.